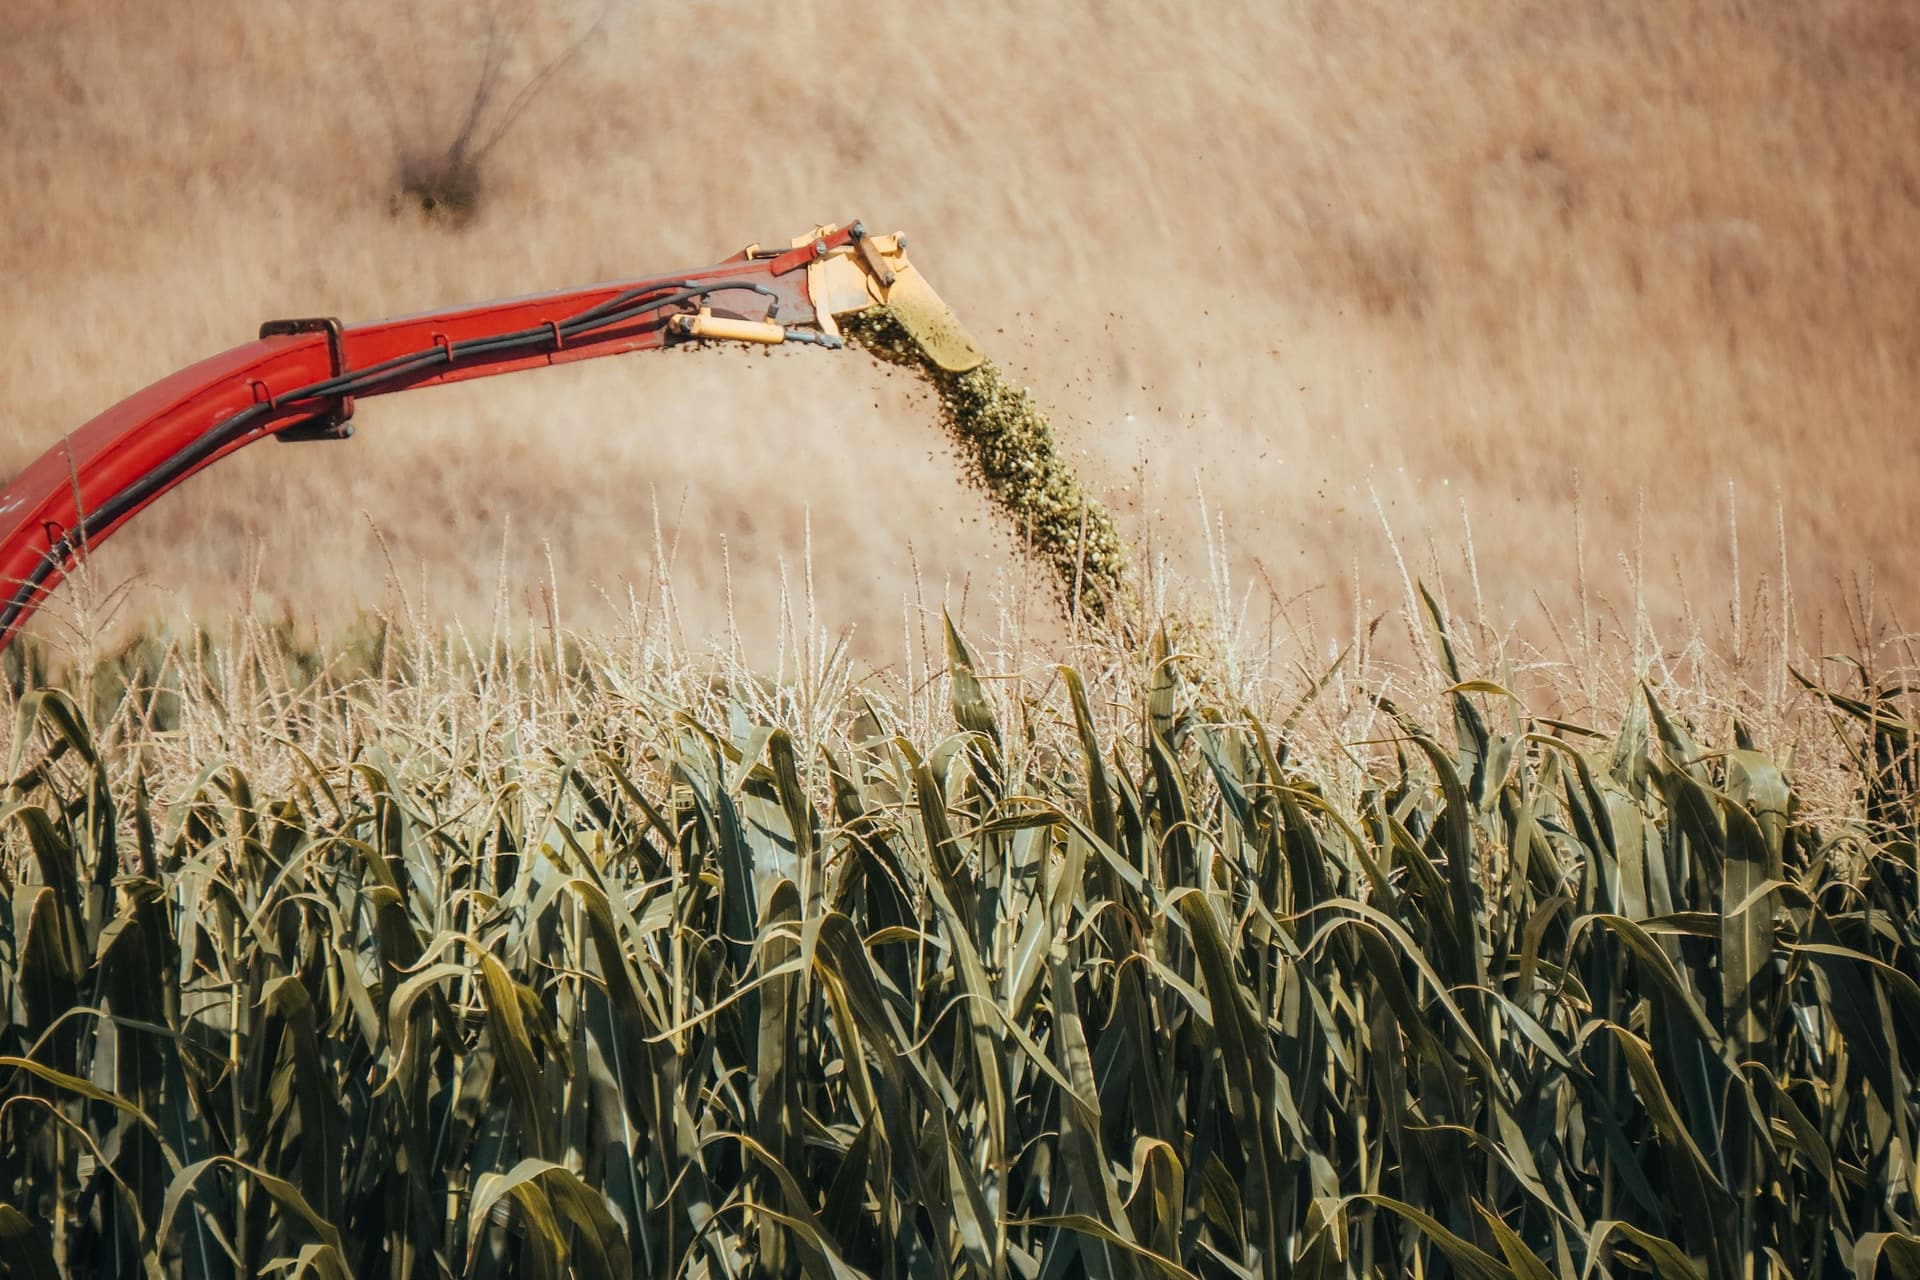
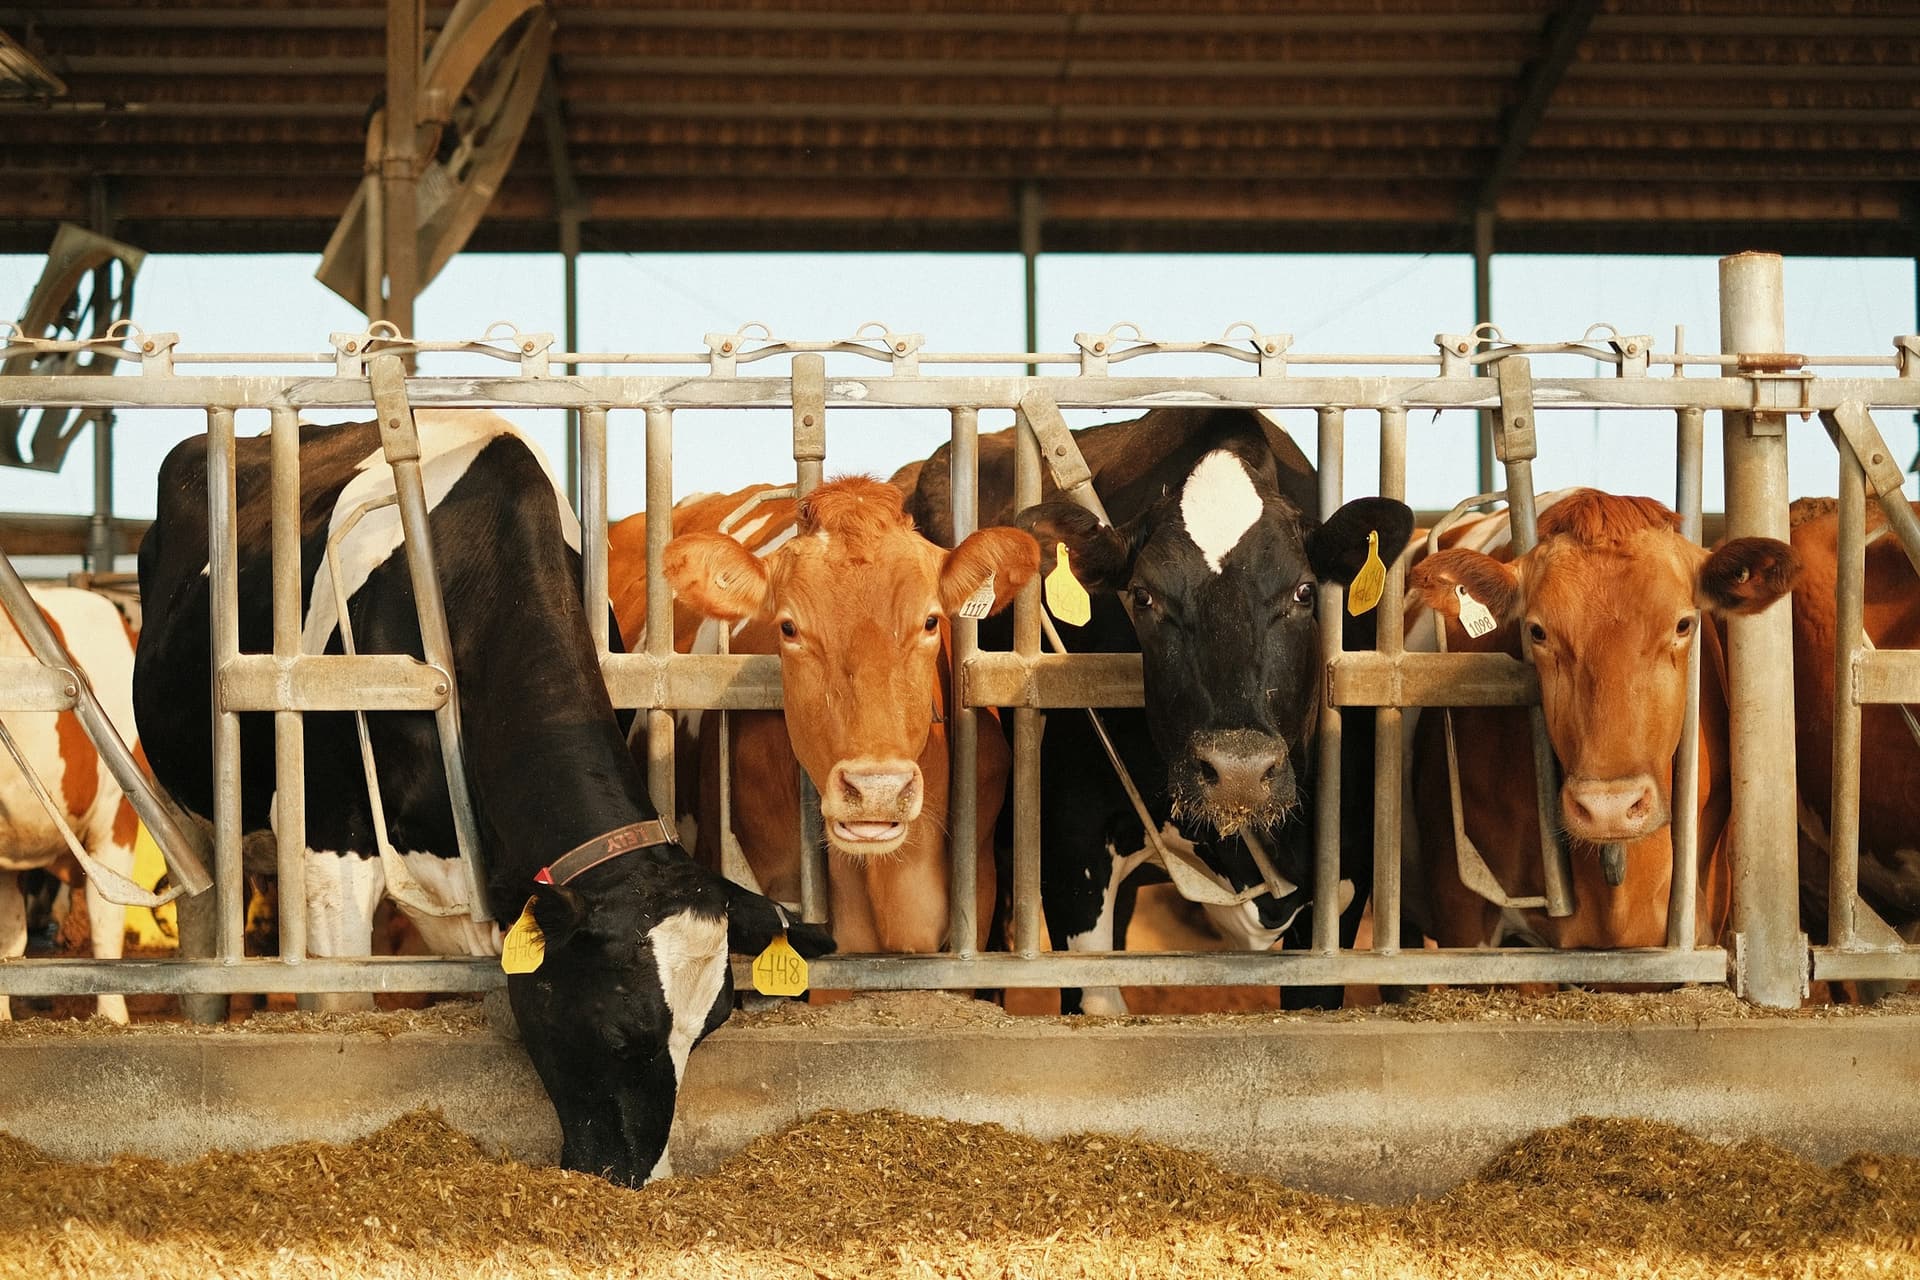
One morning a farm calls: milk yield has been dropping for two days and the cows are less eager at the bunk. The ration has not changed, the mixer loading list is the same, the ingredients are the same. A few questions later the story comes out. It rained over the weekend, a new face was opened in the silage clamp, and that face is noticeably wetter than the last one. The ration on paper is unchanged, but the ration in front of the cows is now a different ration.
A total mixed ration (TMR) feeds forages and concentrates together as one mix. Every mouthful is the same, sorting is reduced and the rumen works more evenly. All of these benefits depend on one condition: the mix that reaches the bunk has to match the mix that was calculated. This article is about the points where that condition breaks down and what you can do about them.
It all starts with dry matter
The water content of forages varies a great deal. Corn silage can run anywhere from 28 to 38 percent dry matter, alfalfa hay sits between 85 and 90 percent, and wet by-products can be below 20 percent. Requirements and nutrient values are calculated on a dry matter basis, but the mixer is loaded by fresh weight. Dry matter content is the bridge between the two, and if the bridge is shaky, so is everything else in the calculation.
An example: a cow giving 30 litres a day
The figures below are illustrative and simplified. A real herd's ration depends on the requirement model, stage of lactation, milk fat and protein, and the analyses of the feeds on hand.
Take a cow of about 650 kg in mid-lactation, giving 30 litres a day at 3.8 percent fat and 3.2 percent protein. A cow like this eats around 22 kg of dry matter a day. Her net energy requirement for maintenance and milk together is roughly 32 Mcal NEL. Divide that by 22 kg of dry matter and the ration needs about 1.45 Mcal NEL per kg of dry matter.
Say the ration has three components: 25 kg of corn silage at 32 percent dry matter, 4 kg of alfalfa hay at 88 percent and 12 kg of concentrate at 89 percent. On a dry matter basis that is 8.0 kg from silage, 3.5 kg from alfalfa and 10.7 kg from concentrate, for a total of 22.2 kg and a forage to concentrate split of about 52 to 48. On paper, everything is in place.
When the silage gets wetter
Now back to the face opened after the rain. Suppose its dry matter has dropped to 28 percent. Loaded with the same 25 kg of silage, the mixer now delivers 7.0 kg of silage dry matter instead of 8.0. Total dry matter falls to 21.2 kg, forage drops below half of the ration and the balance of energy and fiber shifts. The cow may look full, but the ration is a kilogram of dry matter short.
The right correction is to raise the loading amount to match the new dry matter. Delivering the same 8.0 kg of dry matter from silage at 28 percent takes about 28.6 kg fresh. For a group of one hundred cows, that is roughly 360 kg more silage per load. It is not a small number, and you will not find it by guessing.
This is where we see the most loss in the field. If silage dry matter is not checked weekly, and straight away when a new face is opened, even a well-calculated ration turns into a different ration within days. A simple measurement with a microwave or a drying method beats not measuring at all.
Keep forage analyses current
Dry matter is not the only variable. Corn silage from the same field differs in starch, NDF and digestibility depending on harvest timing, variety and year. Library values are a good starting point, but a herd's actual ration needs forage and silage analysis results. OptiFormula TMR lets you use these results alongside the feed library values.
Choose the right requirement model
Dairy cows, beef cattle, calves and heifers, sheep, goats and buffalo have different requirements, and different models calculate them. OptiFormula TMR uses the NASEM 2021, NASEM 2016, INRA 2018, CVB and NRC 2007 models. The models express energy and protein in different units. One works in net energy and metabolizable protein, another uses its own units. So when comparing two rations, make sure they were calculated with the same model. Stating the model in the ration report avoids that confusion.
Fiber is the rumen's seatbelt
The easiest way to add energy is to add concentrate, but there is a limit. When effective fiber falls, meaning the physically effective NDF (peNDF) that drives chewing and rumination, rumen pH drops and the risk of acidosis rises. Many sources suggest forage NDF of roughly 19 to 21 percent of dry matter as a lower bound. The exact figure depends on your model and your herd. What matters is to set that limit as a constraint and not let the formula buy energy at the expense of fiber.
The mixer itself plays a part here. Mix a TMR for too long and straw and hay get chopped too short. Fiber that looks adequate in the analysis loses its effect because the particles are smaller. Mixing time and loading order matter as much as the ration.
Read intake and cost together
The clearest way to look at the cost of a ration is daily cost per head. It shows directly which of two rations meeting the same requirements is cheaper. For milking animals you need one more step: income over feed cost, or IOFC. If milk sold at 18 TRY a litre and the ration cost 12 TRY per kg of dry matter in our example, daily milk income per cow would be 540 TRY, feed cost about 266 TRY and IOFC about 274 TRY. These numbers are again illustrative, but they show the logic. A cheaper ration that lowers milk yield can lower IOFC too.
Dry matter intake belongs in the same picture. A ration that looks perfect on paper but needs more dry matter than the cow can eat cannot work in practice. In OptiFormula TMR, dry matter intake, daily cost per head and IOFC are shown together for every ration.
From paper to the feed bunk
The calculated ration is put into practice through the mixer loading list, which shows how many kilograms of each feed to load. When silage dry matter changes, the list has to be updated too. In the example above, the 360 kg difference repeats every day the list is not updated.
The environmental side of the ration is also coming up more and more. Ration composition directly affects methane production and nitrogen and phosphorus excretion. OptiFormula TMR calculates these outputs as well, so you can see which of two equally priced rations puts less load on the environment.
Back to the farm that called: what solved the problem was not a new ration. Measuring silage dry matter and updating the loading list was enough. A good TMR starts with a good calculation, and it keeps working through accurate measurement and accurate loading.